Note
Go to the end to download the full example code.
Burst Detection
Analyze neural signals for bursts of oscillations of interest.
This tutorial primarily covers the neurodsp.burst module.
# Import burst detection functions
from neurodsp.burst import detect_bursts_dual_threshold, compute_burst_stats

# Import simulation code for creating test data
from neurodsp.sim import sim_combined
from neurodsp.utils import set_random_seed, create_times

# Import utilities for loading and plotting data
from neurodsp.utils.download import load_ndsp_data
from neurodsp.plts.time_series import plot_time_series, plot_bursts
# Set the random seed, for consistency simulating data
set_random_seed(0)
Simulate a Bursty Oscillation
First, we’ll simulate a combined signal with a bursty oscillation in the alpha range, with an aperiodic component.
# Simulation settings
fs = 1000
n_seconds = 5

# Define simulation components
components = {'sim_synaptic_current' : {'n_neurons':1000, 'firing_rate':2,
                                        't_ker':1.0, 'tau_r':0.002, 'tau_d':0.02},
              'sim_bursty_oscillation' : {'freq' : 10, 'enter_burst' : .2, 'leave_burst' : .2}}

# Simulate a signal with a bursty oscillation with an aperiodic component & a time vector
sig = sim_combined(n_seconds, fs, components)
times = create_times(n_seconds, fs)
# Plot the simulated data
plot_time_series(times, sig, 'Simulated EEG')
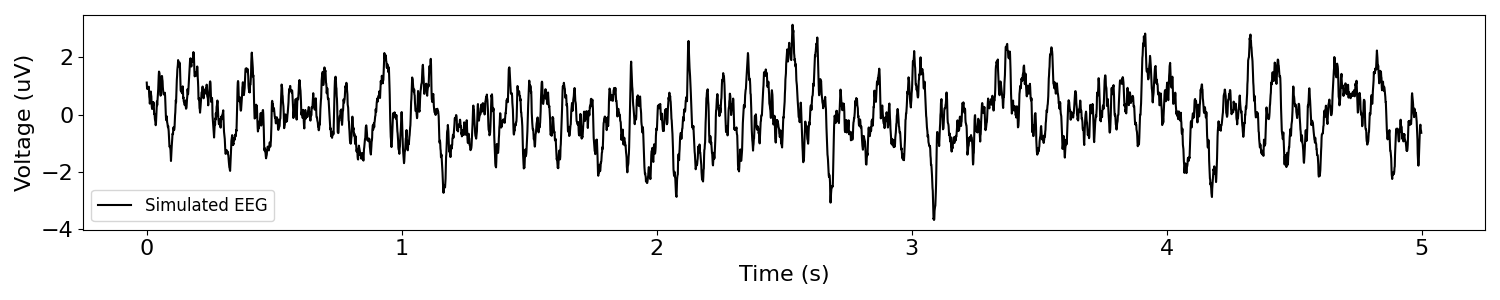
In the simulated signal above, we can see some bursty 10 Hz oscillations.
Dual Amplitude Threshold Algorithm
First, let’s use the dual-amplitude threshold algorithm for burst detection, which
we can use with the detect_bursts_dual_threshold() function.
This algorithm first computes the amplitude at each point in time for a given frequency range. This amplitude is then normalized by the average (default: median) amplitude of the whole time series. Two thresholds are defined based off of this normalized amplitude. In order for a burst to be detected, the amplitude must cross the higher amplitude threshold. The burst lasts until the amplitude then falls below the lower amplitude threshold.
Other Parameters
avg_type: used to set the average for normalization to either ‘median’ or ‘mean’
magnitude_type: used to set the metric for thresholding, to ‘amplitude’ or ‘power’
# Settings for the dual threshold algorithm
amp_dual_thresh = (1, 2)
f_range = (8, 12)

# Detect bursts using dual threshold algorithm
bursting = detect_bursts_dual_threshold(sig, fs, amp_dual_thresh, f_range)
You can plot detected bursts using plot_bursts().
# Plot original signal and burst activity
plot_bursts(times, sig, bursting, labels=['Simulated EEG', 'Detected Burst'])
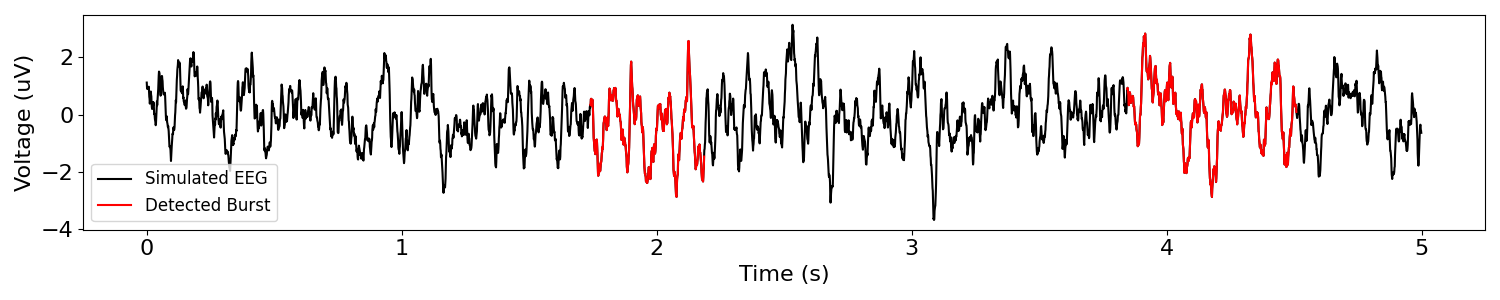
The graph above shows the bursting activity in red.
The algorithm was used with thresh=(1, 2), so any time point with more than 3 times the median magnitude in the alpha range (8-12 Hz) was marked as bursting activity.
Checking Burst Statistics
Once you have detected bursts, you can calculate some statistics on those bursts with
detect_bursts_dual_threshold().
# Compute burst statistics
burst_stats = compute_burst_stats(bursting, fs)

# Print out burst statistic information
for key, val in burst_stats.items():
    print('{:15} \t: {}'.format(key, val))
n_bursts                : 2
duration_mean           : 0.5555
duration_std            : 0.10850000000000001
percent_burst           : 22.22
bursts_per_second       : 0.4
Burst Detection on Real Data
Next up, we’ll load a sample of real neural data, and try out the burst detection.
# Download, if needed, and load example data file
sig = load_ndsp_data('sample_data_1.npy', folder='data')

# Set sampling rate, and create a times vector for plotting
fs = 1000
times = create_times(len(sig)/fs, fs)
# Set the frequency range to look for bursts
f_range = (8, 12)

# Detect bursts using the dual threshold algorithm
bursting = detect_bursts_dual_threshold(sig, fs, (3, 3), f_range)
# Plot original signal and burst activity
plot_bursts(times, sig, bursting, labels=['Data', 'Detected Burst'])
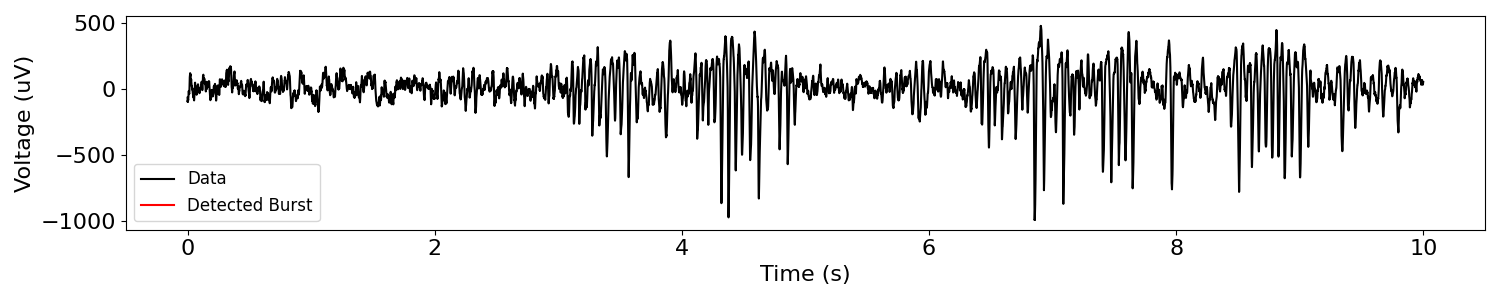
No bursts were detected! There could be a number of reasons for this. One of the easy things to do is to adjust the parameters for burst detection.
Let’s try making the thresholds lower.
# Detect bursts using dual threshold algorithm
bursting = detect_bursts_dual_threshold(sig, fs, (1, 2), f_range)

# Plot original signal and burst activity
plot_bursts(times, sig, bursting, labels=['Data', 'Detected Burst'])
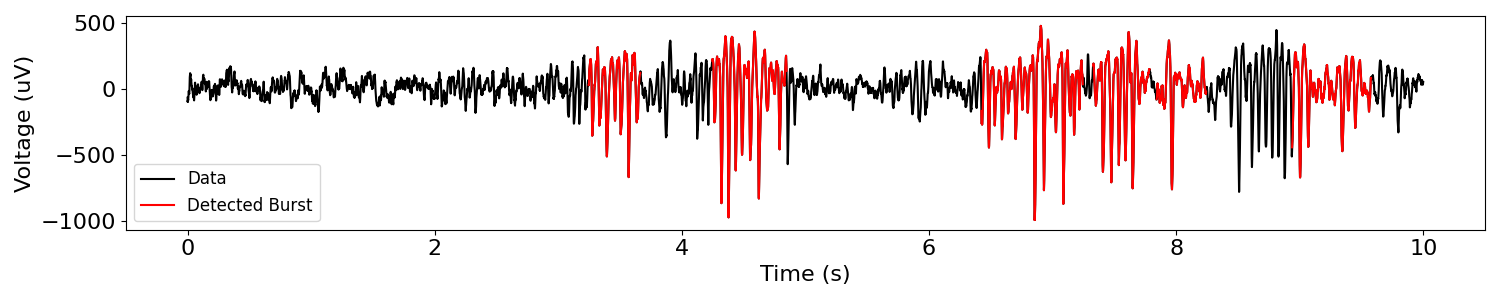
Better, but not very good. Note the undetected cycles just before 9s.
There’s another serious issue: we’re looking for alpha bursts, but the bursts in this data are beta bursts.
# Detect bursts
bursting = detect_bursts_dual_threshold(sig, fs, (1, 2), (13, 30))

# Plot original signal and burst activity
plot_bursts(times, sig, bursting, labels=['Data', 'Detected Burst'])
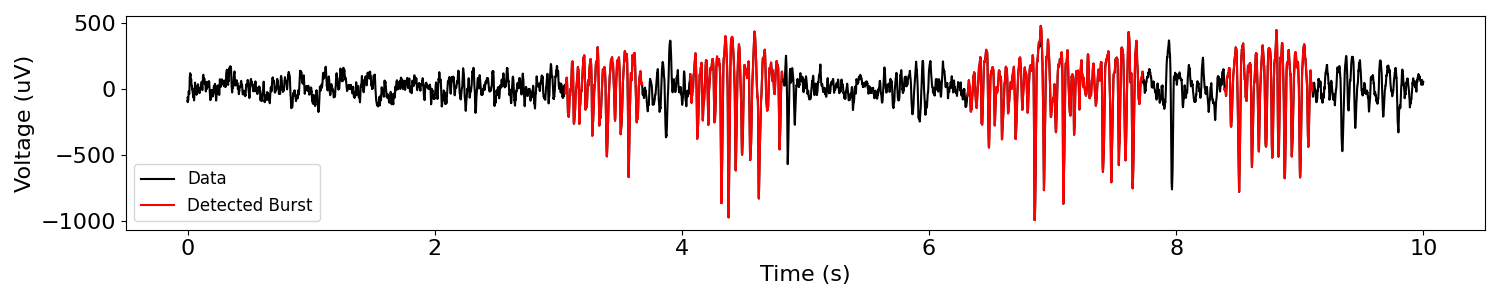
Much better! This just goes to show that burst detection is an art that requires some knowledge of the data you’re working with.
Finally, we can again check our burst statistics.
# Compute burst statistics
burst_stats = compute_burst_stats(bursting, fs)

# Print out burst statistic information
for key, val in burst_stats.items():
    print('{:15} \t: {}'.format(key, val))
n_bursts                : 5
duration_mean           : 0.6981999999999999
duration_std            : 0.09064524256683304
percent_burst           : 34.91
bursts_per_second       : 0.5
Total running time of the script: (0 minutes 0.747 seconds)