neurodsp.plts.plot_bursts
- neurodsp.plts.plot_bursts(times, sig, bursting, ax=None, **kwargs)[source]
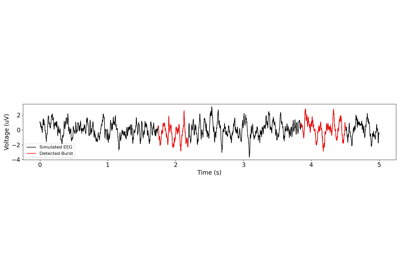
Plot a time series, with labeled bursts.
- Parameters:
- times1d array or None
Time definition for the time series to be plotted. If None, time series will be plotted in terms of samples instead of time.
- sig1d array
Time series to plot.
- bursting1d array
A boolean array which indicates identified bursts.
- axmatplotlib.Axes, optional
Figure axes upon which to plot.
- **kwargs
Keyword arguments to pass into plot_time_series, and/or for customizing the plot.
Examples
Create a plot of burst activity:
>>> from neurodsp.sim import sim_combined
>>> from neurodsp.utils import create_times
>>> from neurodsp.burst import detect_bursts_dual_threshold
>>> sig = sim_combined(n_seconds=10, fs=500,
...                    components={'sim_synaptic_current': {},
...                                'sim_bursty_oscillation' : {'freq': 10}},
...                    component_variances=(0.1, 0.9))
>>> is_burst = detect_bursts_dual_threshold(sig, fs=500, dual_thresh=(1, 2), f_range=(8, 12))
>>> times = create_times(n_seconds=10, fs=500)
>>> plot_bursts(times, sig, is_burst, labels=['Raw Data', 'Detected Bursts'])