neurodsp.plts.plot_autocorr
- neurodsp.plts.plot_autocorr(timepoints, autocorrs, labels=None, colors=None, ax=None, **kwargs)[source]
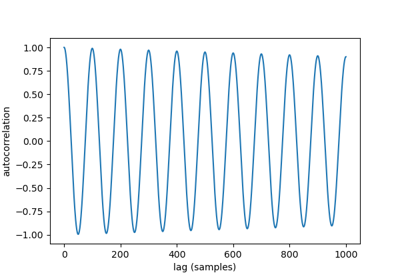
Plot autocorrelation results.
- Parameters:
- timepoints1d array
Time points, in samples, at which autocorrelations are computed.
- autocorrsarray
Autocorrelation values, across time lags.
- labelsstr or list of str, optional
Labels for each time series.
- colorsstr or list of str
Colors to use to plot lines.
- axmatplotlib.Axes, optional
Figure axes upon which to plot.
- **kwargs
Keyword arguments for customizing the plot.