neurodsp.plts.plot_instantaneous_measure
- neurodsp.plts.plot_instantaneous_measure(times, sigs, measure='phase', ax=None, **kwargs)[source]
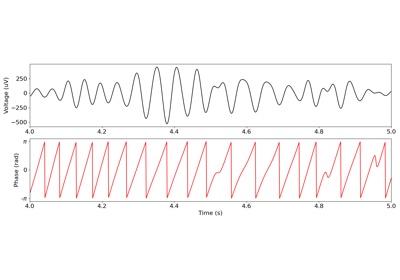
Plot an instantaneous measure, of phase, amplitude or frequency.
- Parameters:
- times1d or 2d array, or list of 1d array, or None
Time definition(s) for the time series to be plotted. If None, time series will be plotted in terms of samples instead of time.
- sigs1d or 2d array, or list of 1d array
Time series to plot.
- measure{‘phase’, ‘amplitude’, ‘frequency’}
Which kind of measure is being plotted.
- axmatplotlib.Axes, optional
Figure axes upon which to plot.
- **kwargs
Keyword arguments to pass into plot_time_series, and/or for customizing the plot.
Examples
Create an instantaneous phase plot:
>>> from neurodsp.sim import sim_combined
>>> from neurodsp.utils import create_times
>>> from neurodsp.timefrequency import phase_by_time
>>> sig = sim_combined(n_seconds=2, fs=500,
...                    components={'sim_powerlaw': {}, 'sim_oscillation' : {'freq': 10}})
>>> pha = phase_by_time(sig, fs=500, f_range=(8, 12))
>>> times = create_times(n_seconds=2, fs=500)
>>> plot_instantaneous_measure(times, pha, measure='phase')