neurodsp.plts.plot_lagged_coherence
- neurodsp.plts.plot_lagged_coherence(freqs, lcs, ax=None, **kwargs)[source]
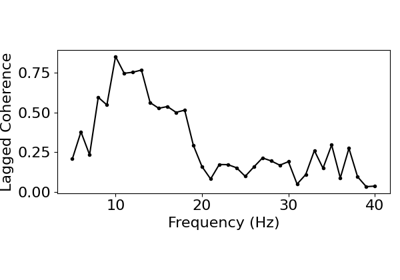
Plot lagged coherence values across frequencies.
- Parameters:
- freqs1d array
Vector of frequencies at which lagged coherence was computed.
- lcs1d array
Lagged coherence values across the computed frequencies.
- axmatplotlib.Axes, optional
Figure axes upon which to plot.
- **kwargs
Keyword arguments for customizing the plot.
Examples
Plot lagged coherence:
>>> from neurodsp.sim import sim_combined
>>> from neurodsp.rhythm import compute_lagged_coherence
>>> sim_components = {'sim_synaptic_current': {},
...                   'sim_bursty_oscillation': {'freq': 20,
...                                              'burst_params': {'enter_burst' : 0.50,
...                                                               'leave_burst' : 0.25}}}
>>> sig = sim_combined(n_seconds=10, fs=500, components=sim_components)
>>> lag_cohs, freqs = compute_lagged_coherence(sig, fs=500, freqs=(5, 35),
...                                            return_spectrum=True)
>>> plot_lagged_coherence(freqs, lag_cohs)