neurodsp.plts.plot_timefrequency
- neurodsp.plts.plot_timefrequency(times, freqs, powers, x_ticks=5, y_ticks=5, colorbar=True, ax=None, **kwargs)[source]
Plot a time-frequency representation of data.
- Parameters:
- times1d array
The time dimension for the time-frequency representation.
- freqs1d array
The frequency dimension for the time-frequency representation.
- powers2d array
Power values to plot. If array is complex, the real component is taken for plotting.
- x_ticks, y_ticksint or array_like
Defines the tick labels to add to the plot. If int, is the number of evenly sampled labels to add to the plot. If array_like, is a set of labels to add to the plot.
- colorbarbool, optional, default: True
Whether to add a colorbar to the plot.
- axmatplotlib.Axes, optional
Figure axes upon which to plot.
- **kwargs
Keyword arguments for customizing the plot.
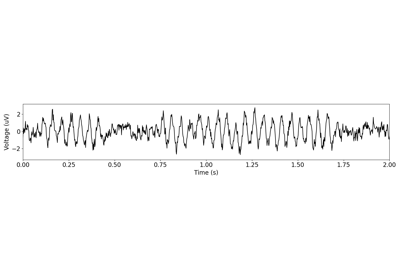
Examples
Plot a Morlet transformation:
>>> import numpy as np
>>> from neurodsp.sim import sim_bursty_oscillation
>>> from neurodsp.timefrequency.wavelets import compute_wavelet_transform
>>> fs=1000
>>> sig = sim_bursty_oscillation(n_seconds=10, fs=fs, freq=10)
>>> times = np.arange(0, len(sig)/fs, 1/fs)
>>> freqs = np.arange(1, 50, 1)
>>> mwt = compute_wavelet_transform(sig, fs, freqs)
>>> plot_timefrequency(times, freqs, mwt)