neurodsp.spectral.compute_scv
- neurodsp.spectral.compute_scv(sig, fs, window='hann', nperseg=None, noverlap=0, outlier_pct=None)[source]
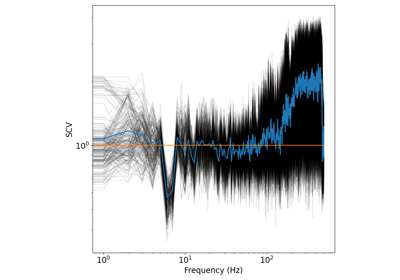
Compute the spectral coefficient of variation (SCV) at each frequency.
- Parameters:
- sigarray
Time series of measurement values.
- fsfloat
Sampling rate, in Hz.
- windowstr or tuple or array_like, optional, default: ‘hann’
Desired window to use. See scipy.signal.get_window for a list of available windows. If array_like, the array will be used as the window and its length must be nperseg.
- npersegint, optional
Length of each segment, in number of samples. If None, and window is str or tuple, is set to 1 second of data. If None, and window is array_like, is set to the length of the window.
- noverlapint, optional, default: 0
Number of points to overlap between segments.
- outlier_pctfloat, optional
Percentage of the windows with the lowest and highest total log power to discard. Must be between 0 and 100.
- Returns:
- freqs1d array
Frequencies at which the measure was calculated.
- scvarray
Spectral coefficient of variation.
Notes
White noise should have a SCV of 1 at all frequencies.
Examples
Compute the spectral coefficient of variation of a simulated time series:
>>> from neurodsp.sim import sim_combined
>>> sig = sim_combined(n_seconds=10, fs=500,
...                    components={'sim_powerlaw': {}, 'sim_oscillation' : {'freq': 10}})
>>> freqs, scv = compute_scv(sig, fs=500)