neurodsp.plts.plot_scv
- neurodsp.plts.plot_scv(freqs, scv, ax=None, **kwargs)[source]
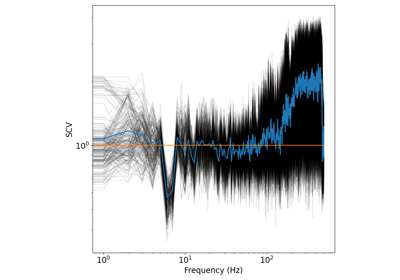
Plot spectral coefficient of variation.
- Parameters:
- freqs1d array
Frequency vector.
- scv1d array
Spectral coefficient of variation.
- axmatplotlib.Axes, optional
Figure axes upon which to plot.
- **kwargs
Keyword arguments for customizing the plot.
Examples
Plot the spectral coefficient of variation:
>>> from neurodsp.sim import sim_combined
>>> from neurodsp.spectral import compute_scv
>>> sig = sim_combined(n_seconds=10, fs=500,
...                    components={'sim_powerlaw': {}, 'sim_oscillation' : {'freq': 10}})
>>> freqs, scv = compute_scv(sig, fs=500)
>>> plot_scv(freqs, scv)