Note
Go to the end to download the full example code.
Spectral Domain Analysis: Power
Apply spectral domain analyses, calculating power measures.
This tutorial primarily covers the neurodsp.spectral.power module.
Overview
This tutorial covers computing spectral power measures, such as the power spectral density (PSD).
# Import spectral power functions
from neurodsp.spectral import compute_spectrum, rotate_powerlaw

# Import utilities for loading and plotting data
from neurodsp.utils import create_times
from neurodsp.utils.download import load_ndsp_data
from neurodsp.plts.spectral import plot_power_spectra
from neurodsp.plts.time_series import plot_time_series
Load example neural signal
First, we load the sample data, an example channel of rat hippocampal LFP data.
# Load example data signal
sig = load_ndsp_data('sample_data_2.npy', folder='data')

# Set sampling rate, and create a times vector for plotting
fs = 1000
times = create_times(len(sig)/fs, fs)
# Plot the loaded signal
plot_time_series(times, sig, xlim=[0, 3])
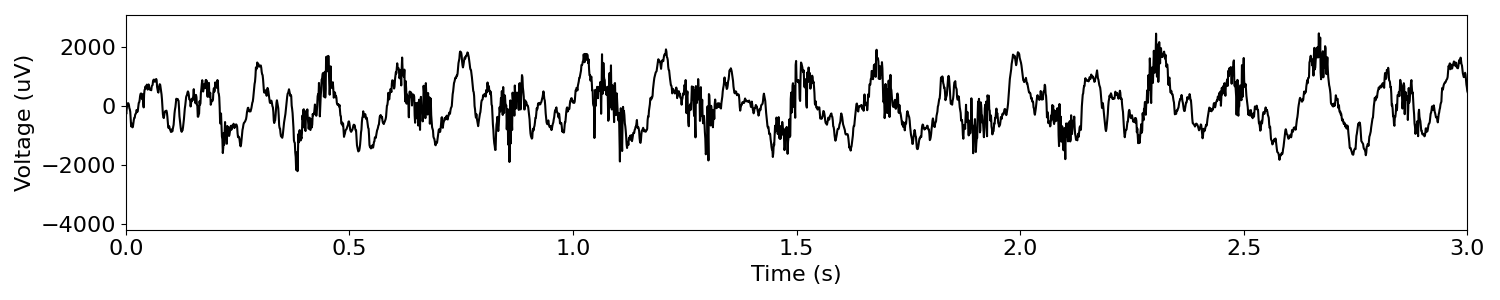
Plotting the data, we observe a strong theta oscillation (~6-8 Hz).
Computing the power spectral density (PSD)
A PSD is a frequency domain representation of a time series.
Using the Fourier transform, the signal is split into orthogonal components of different frequencies, and the amount of power in each frequency is estimated.
The main function for computing power spectra is
compute_spectrum().
There are a few ways of estimating the PSD, with different smoothing:
‘welch’ : averages over windowed power estimates, using Fourier transforms
in this approach, you can also choose how to average across windows
‘mean’ : the traditional welch’s approach, which takes the mean over windows
‘median’ : take the median across windows, which diminishes the the effect of outlier power values
You can do this directly with
compute_spectrum_welch()
‘wavelet’ : uses wavelets to calculate power at designated frequencies
You can do this directly with
compute_spectrum_wavelet()
‘medfilt’ : a median filter of the squared FFT magnitude.
You can do this directly with
compute_spectrum_medfilt()
# Mean of spectrogram (Welch)
freq_mean, psd_mean = compute_spectrum(sig, fs, method='welch', avg_type='mean', nperseg=fs*2)

# Median of spectrogram ("median Welch")
freq_med, psd_med = compute_spectrum(sig, fs, method='welch', avg_type='median', nperseg=fs*2)

# Median filtered spectrum
freq_mf, psd_mf = compute_spectrum(sig, fs, method='medfilt')
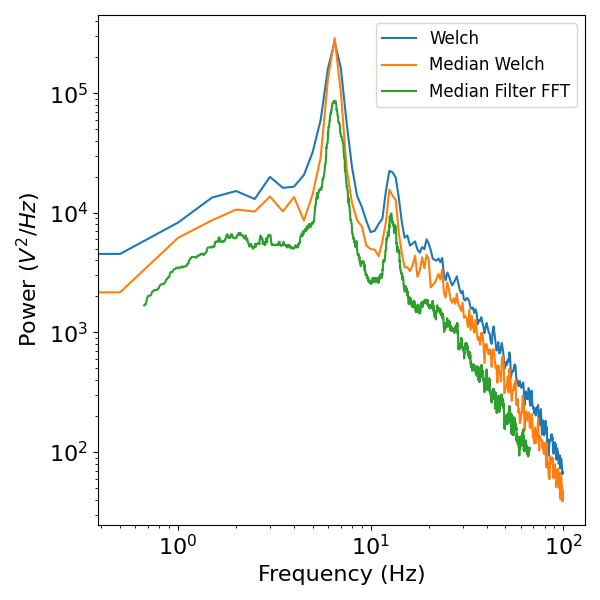
You can plot power spectra with plot_power_spectra().
# Plot the power spectra
plot_power_spectra([freq_mean[:200], freq_med[:200], freq_mf[100:10000]],
                   [psd_mean[:200], psd_med[:200], psd_mf[100:10000]],
                   ['Welch', 'Median Welch', 'Median Filter FFT'])
Aside: Fitting 1/f and oscillations in power spectra
You might notice in the above power spectra that there are regions of band-specific power, reflecting oscillations, as well as regions that show linear decrease when plotted in log-log scale, in particular the frequency region between 30-100Hz.
As well as a large body of work investigating oscillations, this “1/f-like” aperiodic components has been found to correlate with aging, memory, and cognitive control in several previous publications, and has been proposed to reflect the physiological balance between excitation and inhibition.
See for example: Voytek et al., JNeuro, 2015; Podvalny et al., JNeurophysiol, 2015; Gao et al., NeuroImage, 2017; Lombardi et al., Chaos, 2017
If you are interesting in measuring these periodic (oscillatory) and aperiodic (1/f like) components from power spectra, check out the ‘fitting oscillations & one-over f’ toolbox.
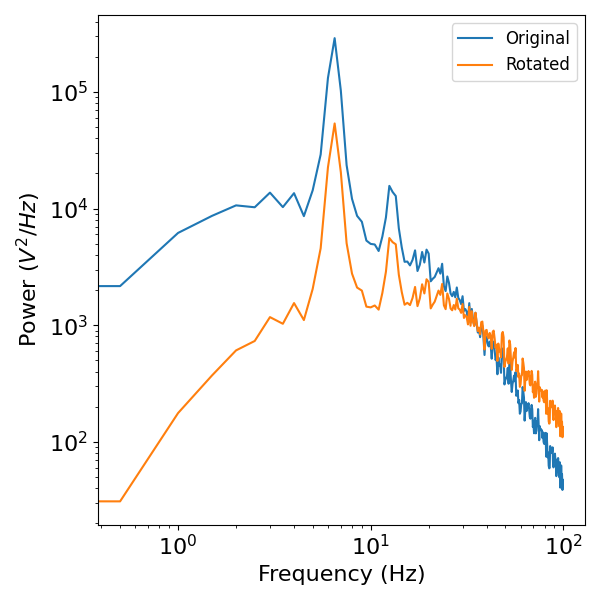
Spectral Rotation
Another included utility function is spectral rotation, which rotates the power spectrum about a given axis frequency, by an amount indicated by the ‘delta_exponent’ argument (negative is clockwise, positive is counterclockwise).
You can perform spectral rotation with rotate_powerlaw().
This function is mostly useful for investigating the effect of rotating the spectrum in frequency domain on the time domain signal. Effectively, this performs a very specific type of filtering with an ultra long filter kernel.
psd_rot = rotate_powerlaw(freq_med, psd_med, delta_exponent=-1, f_rotation=35)

plot_power_spectra([freq_med[:200], freq_med[:200]],
                   [psd_med[:200], psd_rot[:200]],
                   ['Original', 'Rotated'])
Total running time of the script: (0 minutes 1.690 seconds)