neurodsp.spectral.compute_spectrum
- neurodsp.spectral.compute_spectrum(sig, fs, method='welch', **kwargs)[source]
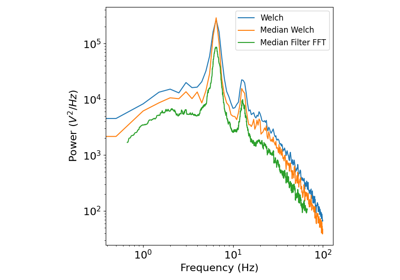
Compute the power spectral density of a time series.
- Parameters:
- sigarray
Time series.
- fsfloat
Sampling rate, in Hz.
- method{‘welch’, ‘wavelet’, ‘medfilt’, ‘multitaper’}, optional
Method to use to estimate the power spectrum.
- **kwargs
Keyword arguments to pass through to the function that calculates the spectrum. See compute_spectrum_{welch, wavelet, medfilt} for details.
- Returns:
- freqs1d array
Frequencies at which the measure was calculated.
- spectrumarray
Power spectral density.
Examples
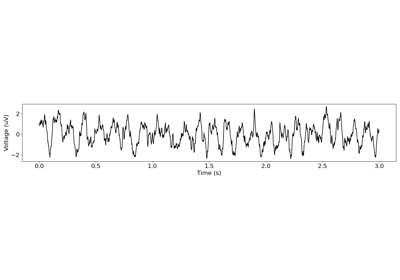
Compute the power spectrum of a simulated time series:
>>> from neurodsp.sim import sim_combined
>>> sig = sim_combined(n_seconds=10, fs=500,
...                    components={'sim_powerlaw': {}, 'sim_oscillation' : {'freq': 10}})
>>> freqs, spectrum = compute_spectrum(sig, fs=500)